← Back to Projects
Machine LearningClustering

Beverage Sales Dataset Clustering with K-Means

Machine Learning — Unsupervised Clustering

Project Overview

This project applies unsupervised machine learning to the Beverage Sales dataset, containing 8,999,910 transaction rows and 11 original features. K-Means clustering is used to discover purchasing patterns from customer type, unit price, quantity, discount, and total transaction value.
Tools Used

PythonPandasNumPyMatplotlibSeabornscikit-learnK-MeansPCAStandardScalerLabelEncoderSimpleImputergdown

Dataset & Features

The dataset contains beverage sales transactions with numerical and categorical variables. After preprocessing, the clustering model uses Customer_Type, Unit_Price, Quantity, Discount, and Total_Price.

Machine Learning Workflow

Dataset Loading → Exploratory Data Analysis → Feature Selection → Label Encoding → Standardization → K-Means Clustering → Elbow & Silhouette Evaluation → PCA → Cluster Interpretation

Model Evaluation

01

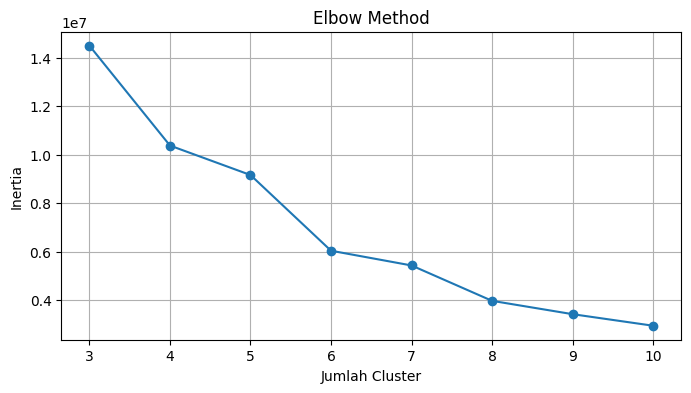
The clustering model was configured with 3 clusters using K-Means.

02

The sampled Silhouette Score reached approximately 0.712 before PCA-based optimization.

03

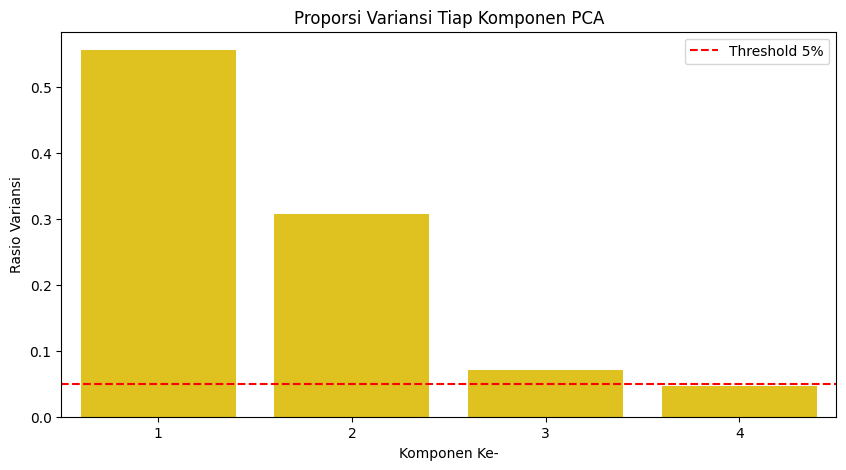
After PCA retained 95% of the variance, the sampled Silhouette Score reached 0.7239.

Cluster Characteristics

01

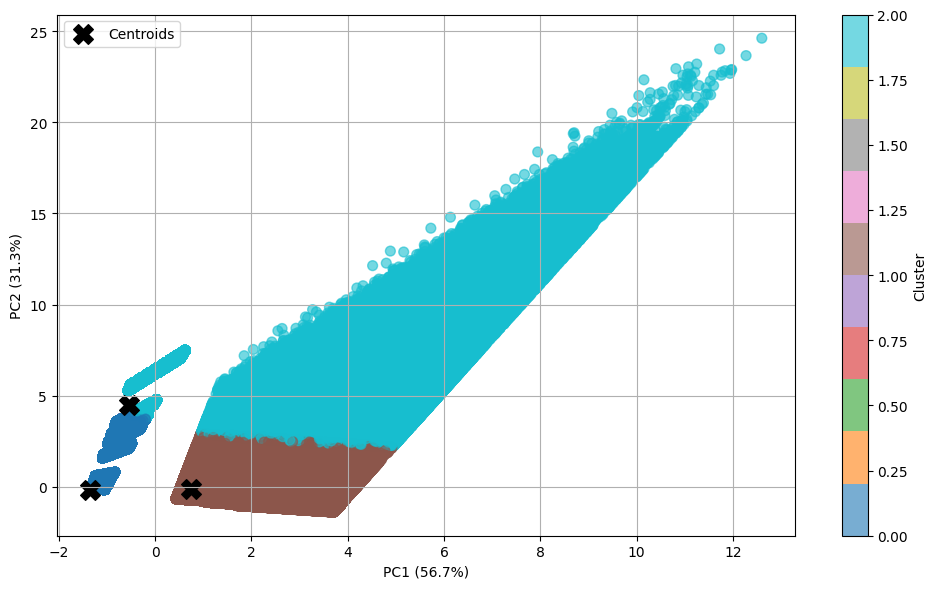
Cluster 0 represents lower-value purchases with an average unit price of 4.47, average quantity of 7.99, and average total price of 35.17.

02

Cluster 1 represents high-volume purchases with an average quantity of 49.65 and average total price of 135.18.

03

Cluster 2 represents premium, high-value transactions with an average unit price of 72.70 and average total price of 2,425.09.

Model & Analysis Results

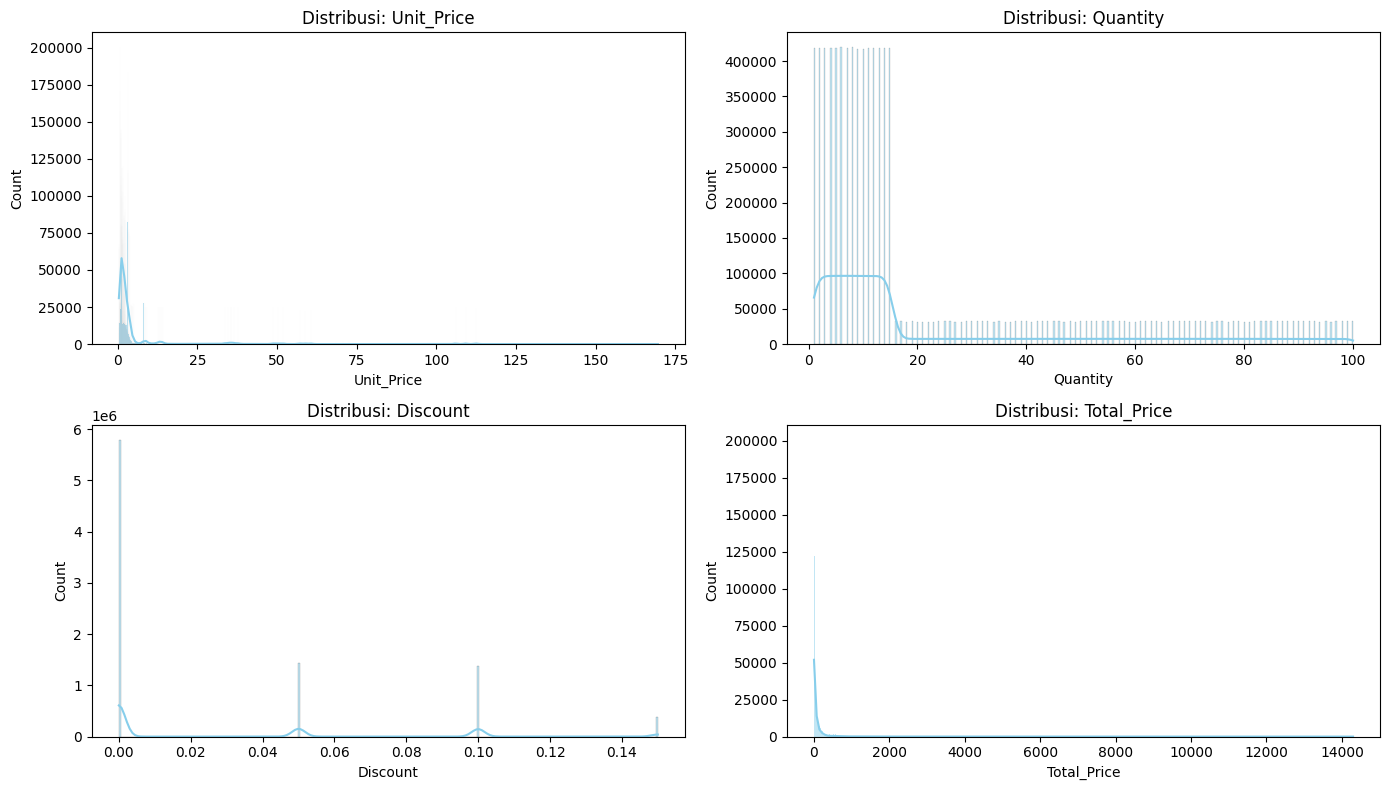
Numerical feature distributions in Beverage Sales dataset
Distribution of numerical features in the Beverage Sales dataset
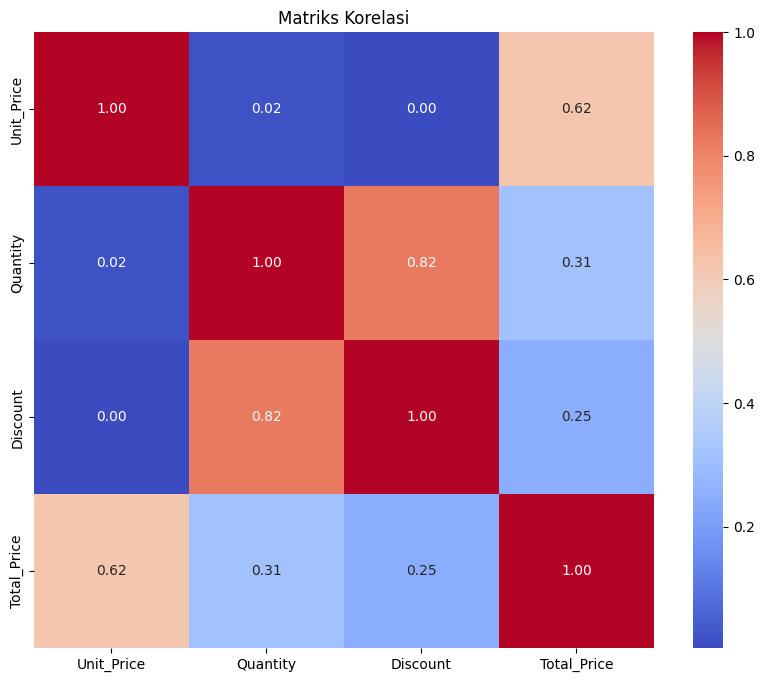
Correlation matrix of Beverage Sales numerical features
Correlation matrix of numerical features
Elbow Method chart for K-Means clustering
Elbow Method for evaluating the number of clusters
PCA explained variance chart
Explained variance across PCA components
PCA visualization of three K-Means clusters
2D PCA visualization of the three K-Means clusters