← Back to Projects
Data AnalysisDashboard

Bike Sharing Analysis

Data Analysis & Interactive Dashboard

Project Overview

This project analyzes Bike Sharing rental data from 2011 to 2012 to understand usage patterns across years, months, hours, and seasons. The analysis covers data wrangling, exploratory data analysis, visualization, and an interactive Streamlit dashboard.
Tools Used

PythonPandasNumPyMatplotlibSeabornStreamlit

Business Questions

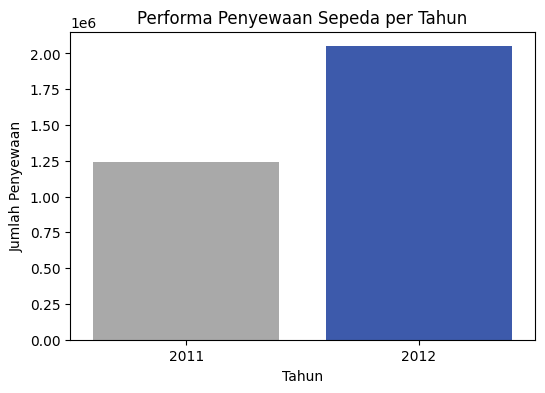
  1. How did bike rental performance change from 2011 to 2012?
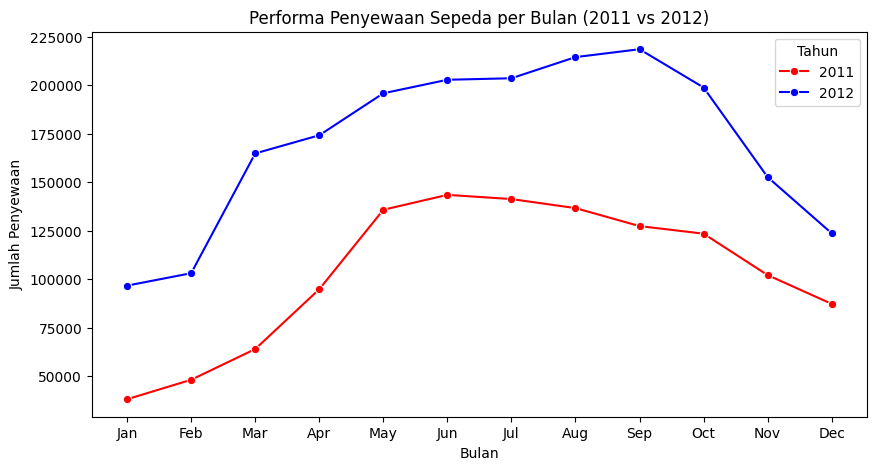
  2. How did monthly rental performance vary during 2011–2012?
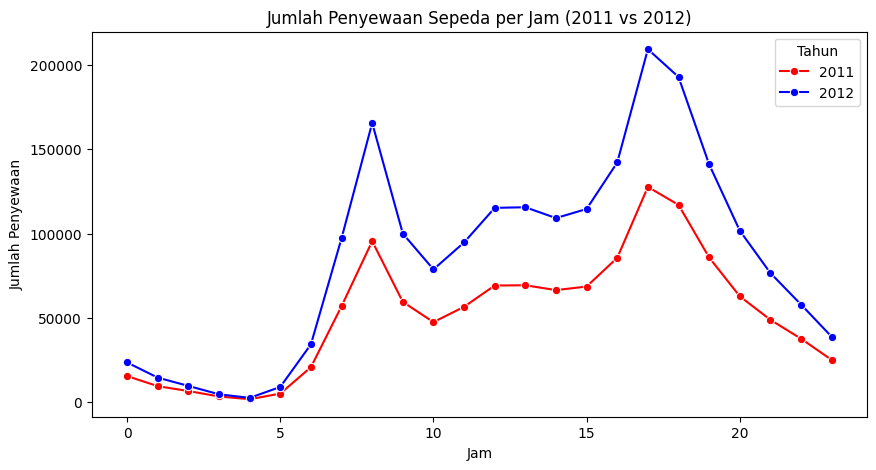
  3. How did bike rentals vary by hour during 2011–2012?
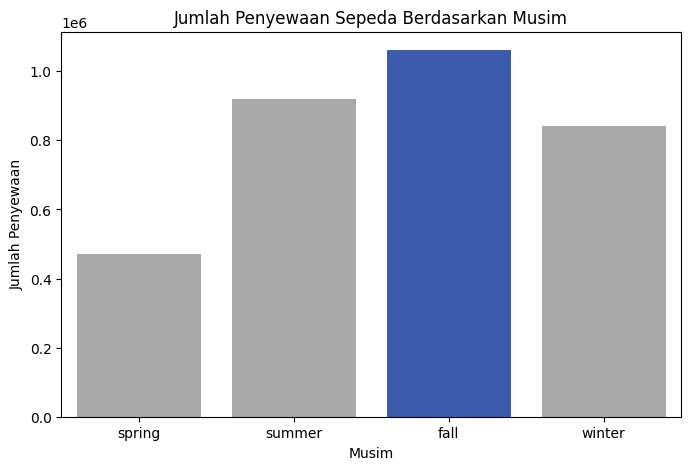
  4. Which season recorded the highest number of bike rentals?

Analysis Workflow

Data Gathering → Data Assessment → Data Cleaning → Exploratory Data Analysis → Visualization → Streamlit Dashboard

Key Insights

01

Total rentals increased substantially from about 1.25 million in 2011 to around 2 million in 2012.

02

Rental activity generally increased toward the middle of the year, with strong demand around June to September.

03

Hourly usage peaked around 8 AM and 5 PM, indicating strong commuter-related usage patterns.

04

Fall recorded the highest total bike rentals among the four seasons.

Analysis Results

Bike rentals by year chart
Yearly bike rental performance
Monthly Bike Sharing rental comparison chart
Monthly rental comparison between 2011 and 2012
Hourly Bike Sharing rental pattern chart
Hourly bike rental patterns
Bike rentals by season chart
Bike rentals by season