← Back to Projects
Data AnalysisDashboardGeospatial

PJU Condition Analysis Dashboard — Tasikmalaya Regency

Data Analysis, Geospatial Mapping & Interactive Dashboard

Project Overview

This project analyzes the condition and spatial distribution of Public Street Lighting (PJU) across Tasikmalaya Regency. The workflow combines data cleaning, exploratory analysis, condition classification, spatial joining with district boundaries, static and interactive mapping, and a Streamlit dashboard for easier exploration.
Tools Used

PythonPandasNumPyGeoPandasShapelyMatplotlibSeabornFoliumBrancascikit-learnRandom ForestLabelEncoderStreamlit

Dataset & Processing

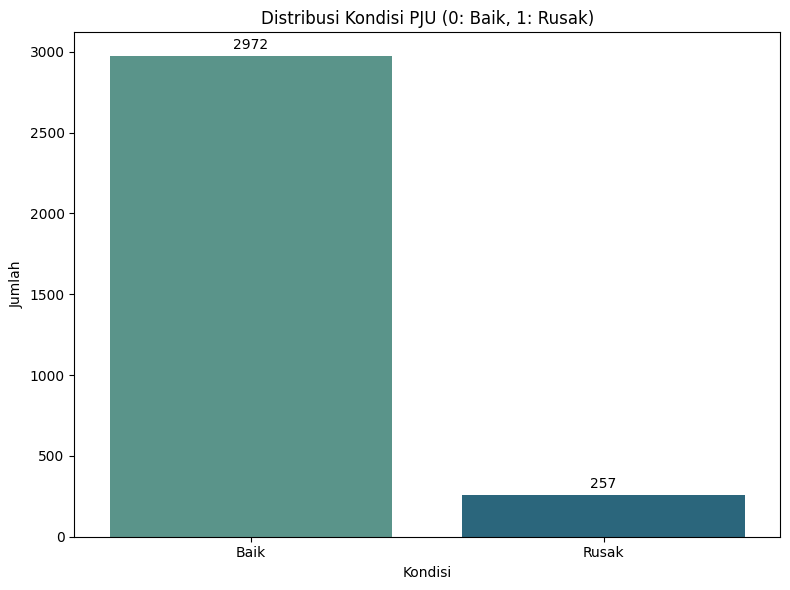
The raw dataset contains 5,589 PJU records with location, coordinates, condition, PJU type, pole type, and lamp type. After handling missing values, 4,235 records remained for condition analysis. A spatial join with the Tasikmalaya Regency district GeoJSON retained 3,229 records whose coordinates fall inside the mapped district boundaries.

Analysis Workflow

Data Loading → Data Cleaning → District Extraction → Exploratory Feature Importance → Condition Classification → Coordinate Parsing → GeoDataFrame Creation → Spatial Join → District Summary → Static & Interactive Maps → Streamlit Dashboard

Key Insights

01

After non-spatial cleaning, the dataset contains 3,777 PJU in good condition and 458 damaged PJU.

02

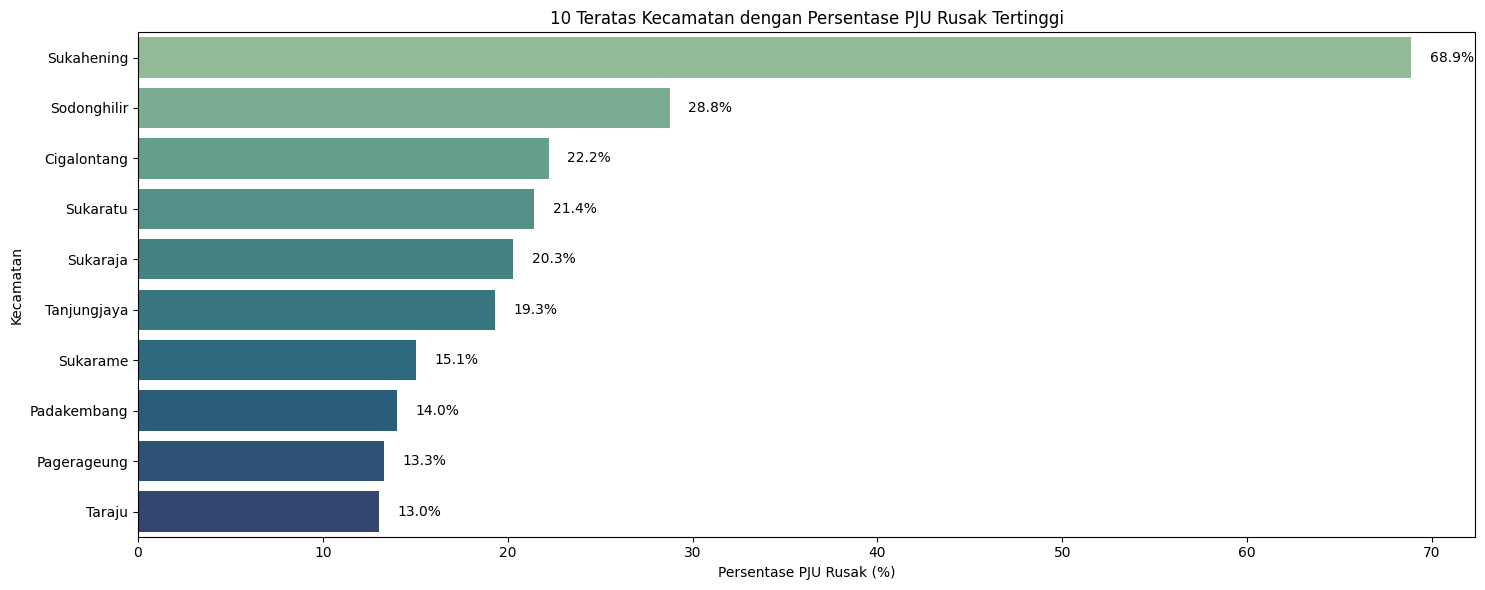
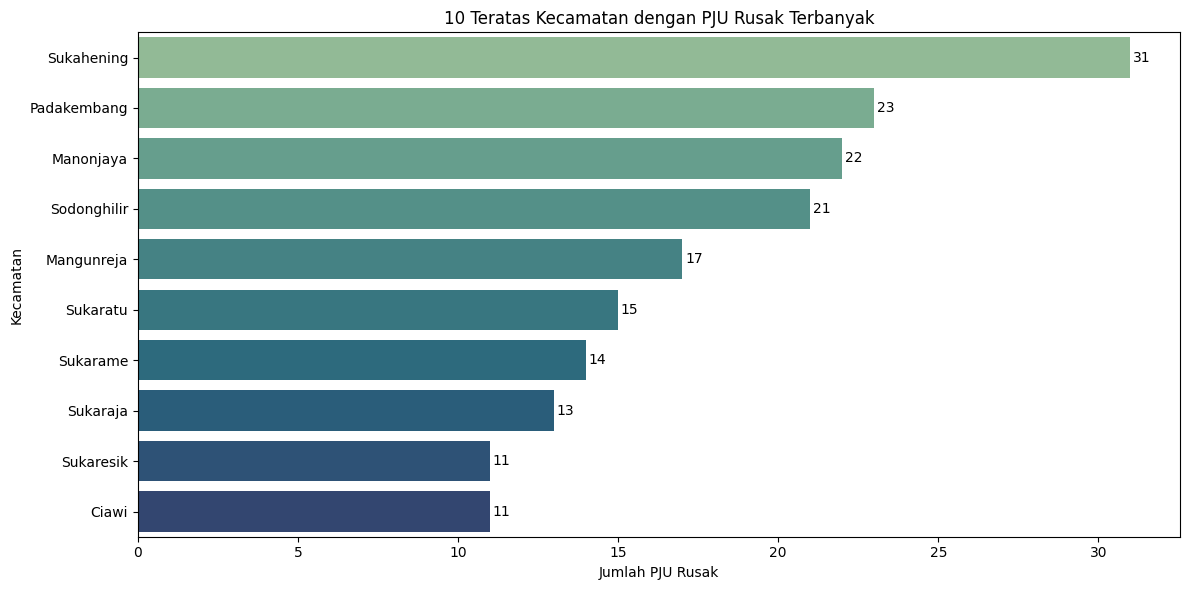
Sukahening recorded the highest damaged count in the district summary shown in the notebook, with 31 damaged PJU and a damaged percentage of about 68.9%.

03

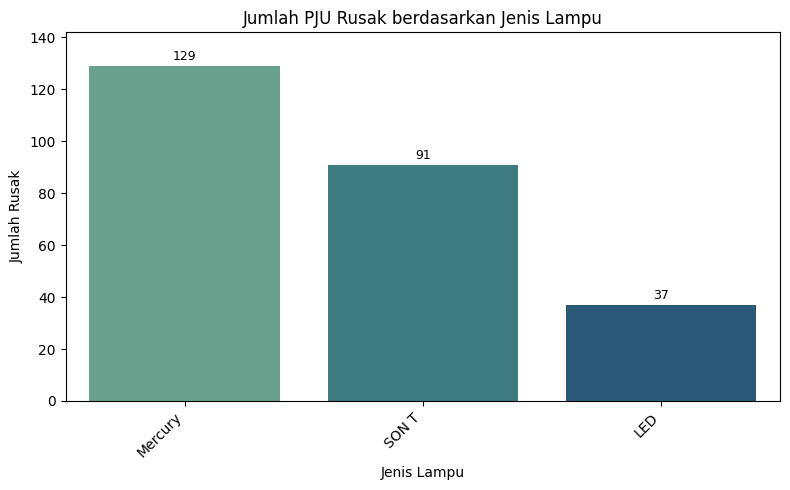
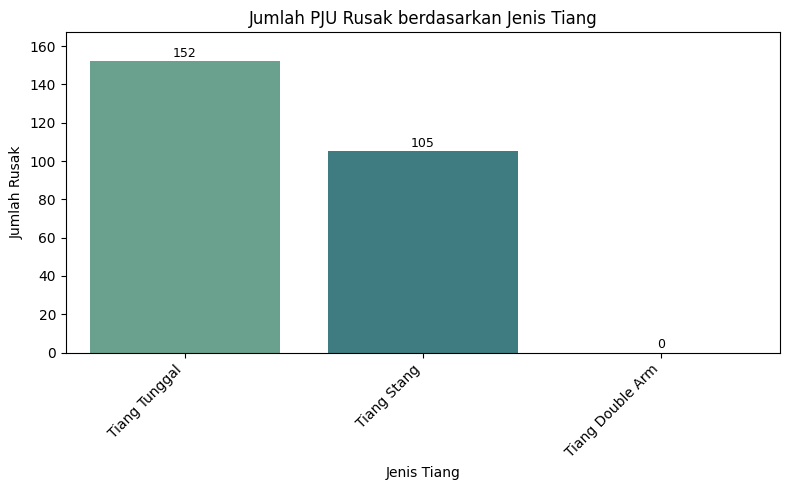
Among the technical attributes examined, lamp type showed a stronger relationship with PJU condition than pole type in the exploratory feature-importance analysis.

04

The notebook concludes that maintenance attention should prioritize vulnerable pole and lamp categories, while the findings should be treated as an initial indication because the available variables are limited and the category distribution is uneven.

Analysis & Geospatial Results

Distribution of good and damaged PJU
Distribution of PJU condition: good versus damaged
Top ten districts with the most damaged PJU
Top 10 districts with the highest number of damaged PJU
Top ten districts by damaged PJU percentage
Top 10 districts by damaged PJU percentage
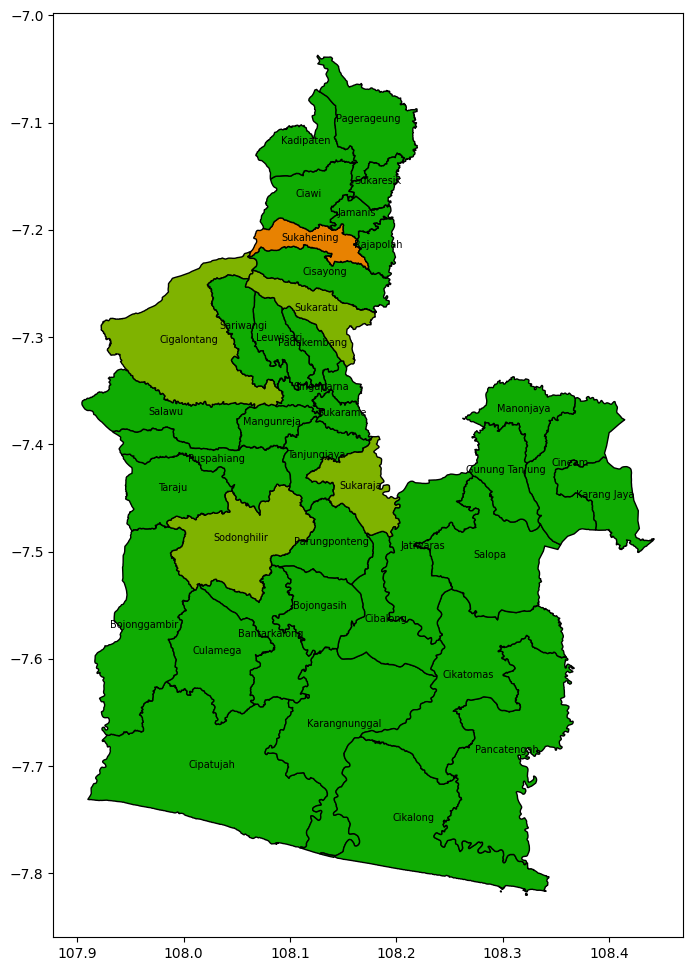
Tasikmalaya Regency map colored by damaged PJU category
Tasikmalaya Regency district map categorized by damaged-PJU percentage
Damaged PJU by lamp type
Damaged PJU counts by lamp type
Damaged PJU by pole type
Damaged PJU counts by pole type

Important Note

The analysis is a snapshot based on the available attributes. It does not include factors such as installation age, installation quality, weather, accident exposure, or usage intensity. Because some categories have much smaller populations than others, percentage-based damage comparisons should be interpreted carefully.