← Back to Projects
Machine LearningPredictive AnalyticsRegression

Predictive Analytics — Red Wine Quality Prediction

Machine Learning — Regression Modeling

Project Overview

This predictive analytics project uses physicochemical measurements to estimate red wine quality. Three regression approaches—Linear Regression, Support Vector Regressor, and Gradient Boosting Regressor—are compared, with hyperparameter tuning applied to the more advanced models.
Tools Used

PythonPandasNumPyMatplotlibSeabornscikit-learnLinear RegressionSVRGradient BoostingGridSearchCVStandardScaler

Dataset & Features

The UCI Wine Quality red wine dataset contains 1,599 records, 11 physicochemical input features, and the quality score as the regression target. After removing 240 duplicate rows, 1,359 unique samples remain for modeling.

Machine Learning Workflow

Data Understanding → Duplicate Removal → Feature/Target Split → 80/20 Train-Test Split → StandardScaler → Linear Regression, SVR & Gradient Boosting → GridSearchCV → MAE, RMSE & R² Evaluation

Key Findings

01

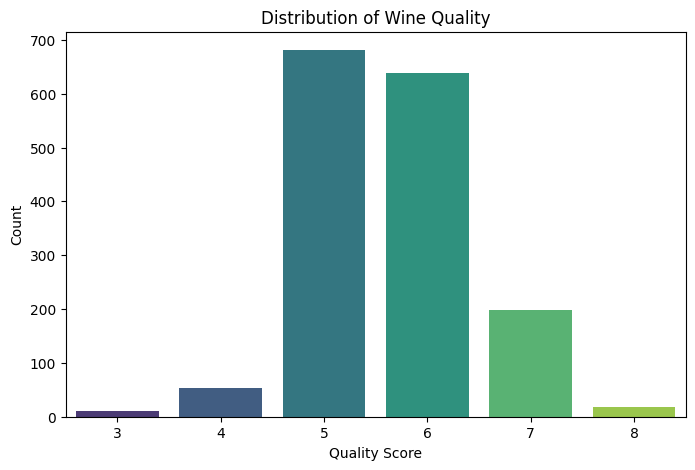
Wine quality scores range from 3 to 8, with most observations concentrated at quality 5 and 6.

02

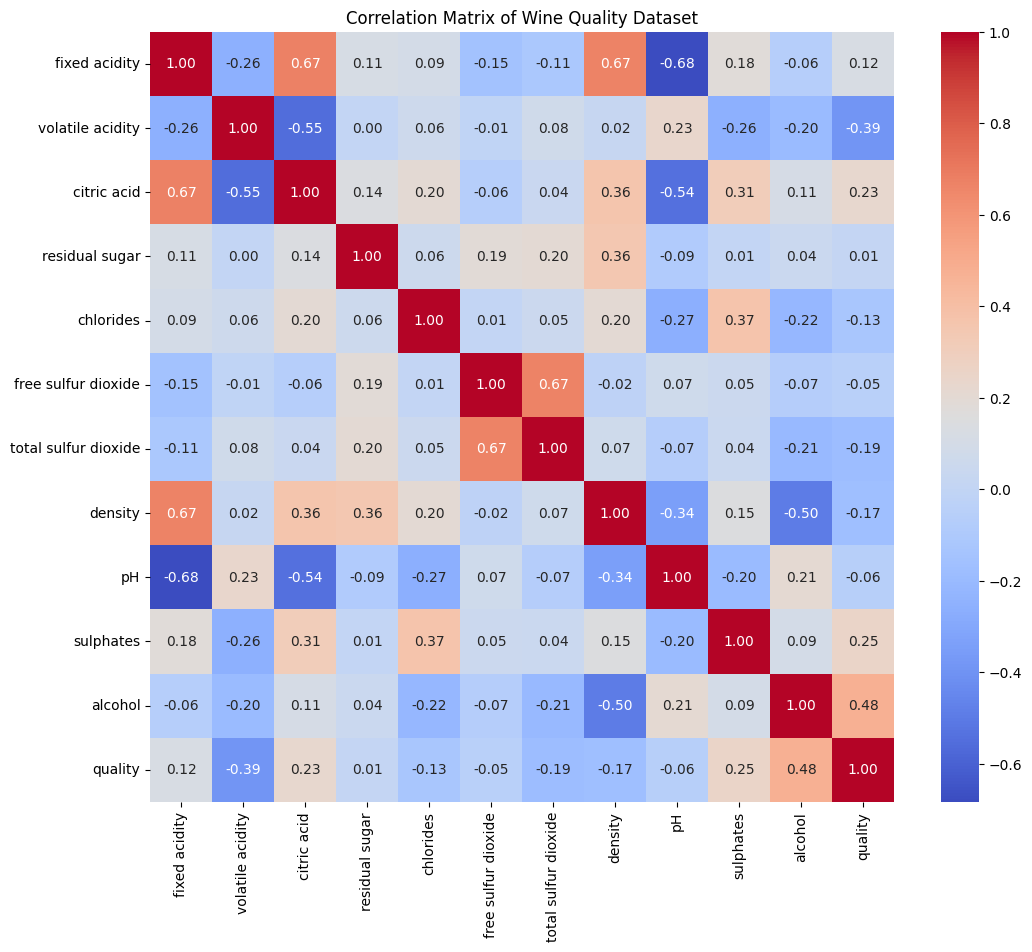
Alcohol shows a positive relationship with quality, while volatile acidity shows a notable negative relationship.

03

After cleaning, 1,087 samples are used for training and 272 samples for testing.

04

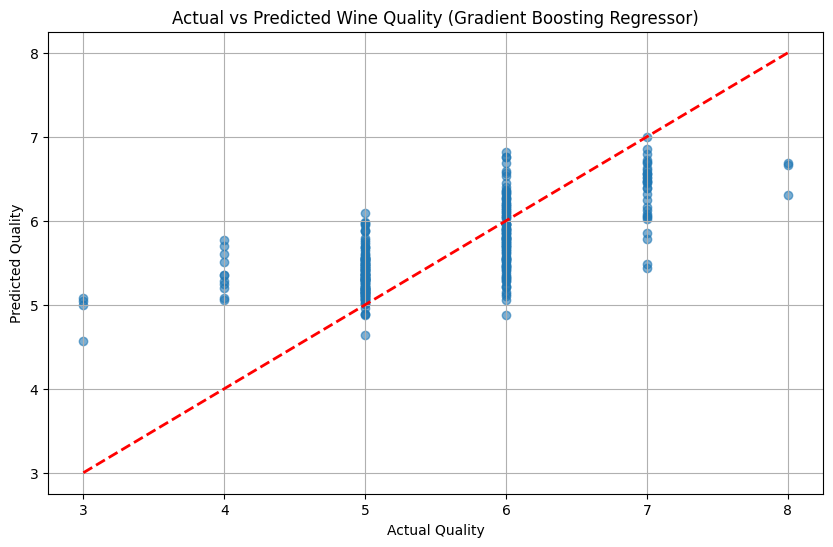
Gradient Boosting Regressor provides the strongest final test performance among the evaluated models.

Final Model Evaluation

R²

R² Score: 0.4560 — the model explains about 45.60% of the variance in red wine quality.

MAE

MAE: 0.4806 — predictions differ from the actual quality score by about 0.48 points on average.

RMSE

RMSE: 0.6208 — this metric places greater weight on larger prediction errors.

Best

Selected model: Gradient Boosting Regressor with learning_rate 0.05, max_depth 3, and n_estimators 100 after GridSearchCV.

Analysis & Prediction Results

Distribution of red wine quality scores
Distribution of the red wine quality target
Correlation heatmap of red wine features
Correlation heatmap across physicochemical features and quality
Actual versus predicted wine quality
Actual versus predicted quality using Gradient Boosting Regressor
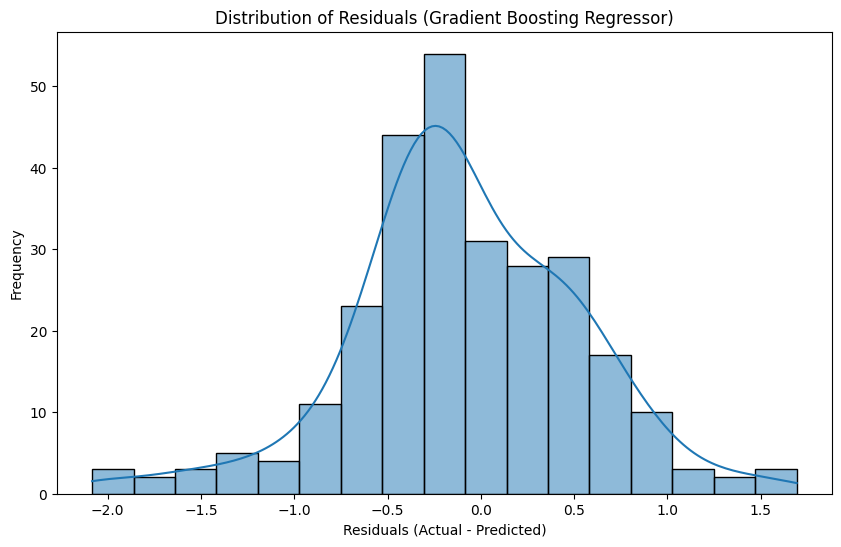
Residual histogram
Distribution of prediction residuals
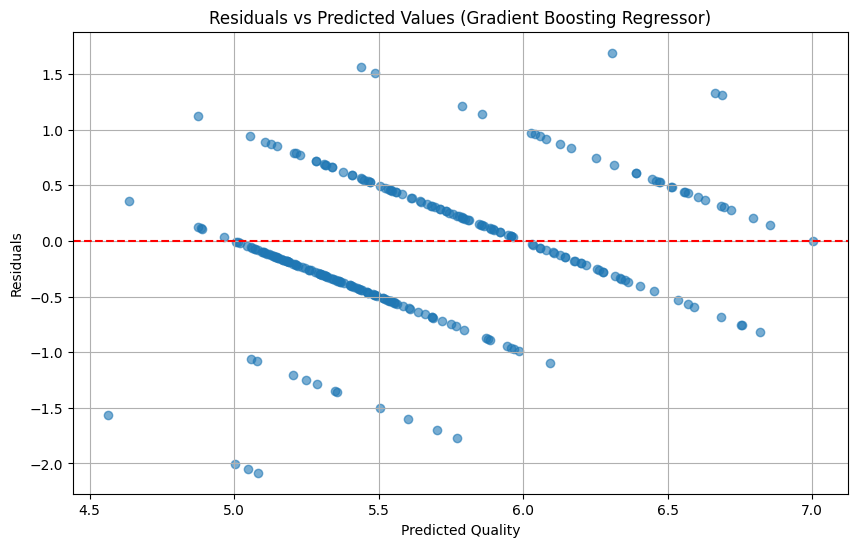
Residuals versus predicted values
Residuals versus predicted quality values